

Which numbers to track, how to read them together, and what to investigate when higher sales do not improve the financial position.
Imagine finishing a quarter with sales up 20%. The team has delivered more work, management is discussing expansion, and the revenue chart looks encouraging.
Then you review the rest of the numbers. Operating profit has fallen by more than half. Customers are taking longer to pay, and more money is tied up in receivables.
Is the business performing better?
The most useful financial key performance indicators (KPIs) for a growing business connect revenue with profitability, working capital, cash generation, and the resources needed for the next stage of growth. For a larger company, that view should also extend to business units, capital employed, and debt commitments.
My preference is to begin with the decisions the management team needs to make. I would rather review a small set of well-defined measures with clear ownership than a crowded dashboard nobody uses to change a decision.
A growth story that looks different below the revenue line
Consider this fictional distributor. Each reporting period contains 90 days, all sales are on credit, and accounting definitions are unchanged. Operating expenses include depreciation where applicable; operating profit is before interest and tax. The figures are illustrative, not industry benchmarks.
| Financial measure | Period A | Period B |
| Revenue | $900,000 | $1,080,000 |
| Gross profit | $360,000 | $367,200 |
| Gross margin | 40% | 34% |
| Operating expenses | $270,000 | $324,000 |
| Operating profit | $90,000 | $43,200 |
| Operating profit margin | 10% | 4% |
| Average trade receivables | $350,000 | $600,000 |
| Days sales outstanding | 35 days | 50 days |
Revenue increased by 20%, but operating profit fell by 52%. Gross profit barely increased because the gross margin weakened. Meanwhile, operating expenses rose by $54,000 and the average amount outstanding from customers increased by $250,000.
These are different problems. They need different investigations, rather than a single instruction to “improve performance.”
Read revenue growth alongside gross margin
Revenue growth = (Current-period revenue − Prior-period revenue) ÷ Prior-period revenue × 100%.
Use comparable periods and consistent recognition policies. Separate changes in volume, selling price, and sales mix before concluding that demand has strengthened. For a group buying another business, distinguish acquisition growth from growth in the existing operation.
Then calculate:
Gross margin = (Revenue − Cost of goods or services sold) ÷ Revenue × 100%.
BDC identifies gross margin as a measure of the amount remaining after direct costs, available to cover other business expenses. Its guidance also emphasizes comparing businesses within relevant industries rather than treating one ratio as universal. [1]
In the distributor example, gross margin fell by six percentage points, from 40% to 34%. That is not a 6% relative decline; the relative decline is 15%.
At Period B’s revenue, maintaining a 40% gross margin would have generated $432,000 of gross profit. Actual gross profit was $367,200—a $64,800 difference.
That calculation tells me where to focus. I would investigate discounting, product mix, supplier costs, freight treatment, and returns before proposing an across-the-board spending cut. It does not, by itself, tell us which explanation is correct.
Measure contribution before allocating shared overhead
Gross margin and contribution margin answer different questions. Contribution analysis separates variable costs from fixed costs; the SBA’s break-even framework uses the amount remaining after variable costs to determine how much activity is needed to cover fixed costs. [7]
Contribution margin = Revenue − Variable costs included in the analysis.
Contribution margin ratio = Contribution margin ÷ Revenue × 100%.
Define the included costs explicitly. For a product channel, you might include product costs, transaction fees, variable fulfillment, and sales commissions. A salaried employee’s pay should not be treated as variable merely because the employee helps deliver the service.
Calculate contribution by the segment where a decision can actually be made: product family, customer group, location, or service line. Show shared overhead separately.
For a proposed closure, my recommendation is to identify which costs would genuinely disappear. Allocating head-office rent to a product does not mean that rent will fall when the product is removed. At the same time, positive contribution does not establish long-term viability: the business must still cover its total costs, and scarce capacity may have a more profitable use.
A break-even calculator can help test price, volume, and cost assumptions. It cannot determine those assumptions for you or replace a cash forecast.
Track operating margin—and explain the movement
Operating profit margin = Operating profit ÷ Revenue × 100%.
For this article, operating profit is after operating expenses, including depreciation and amortization, but before interest and tax. Keep that definition consistent with the management accounts. ACCA’s ratio-analysis guidance explains operating margin and the importance of interpreting ratios together. [5]
Our distributor’s margin fell from 10% to 4%. The calculation already shows that higher sales did not produce a stronger operating result.
The operating-profit reconciliation is explicit: start with $90,000, add $72,000 from additional revenue at the previous 40% margin, subtract $64,800 for the lower margin at the new revenue level, and subtract $54,000 of additional operating expenses. The result is $43,200.
Some additional overhead may have been an intentional investment in capacity; some may reflect avoidable cost increases. Management needs to distinguish them before changing the plan.
When a reporting pack also includes EBITDA, I ask for a bridge to operating profit, net profit, and cash, with material adjustments explained. I do not use those labels interchangeably.
Find where cash is tied up
Days sales outstanding and overdue receivables
Days sales outstanding (DSO) = Average trade receivables ÷ Credit sales for the period × Days in the period.
This average-collection-period calculation relates receivables to credit sales, rather than automatically using total sales where cash sales are significant. BDC provides this formula, alongside the corresponding payables and inventory measures. [2]
For Period B:
$600,000 ÷ $1,080,000 × 90 = 50 days.
At the previous 35-day collection level, the same sales volume would imply average receivables of:
$1,080,000 ÷ 90 × 35 = $420,000.
The difference is $180,000. Under these simplified assumptions, that is the additional average receivables investment associated with slower collection. The remaining $70,000 of the $250,000 increase reflects higher sales at the previous collection level.
This is not a guaranteed immediate cash release, and it is not an expense. Average balances also do not directly provide the period-end balance changes used in a cash-flow statement.
Accompany DSO with an invoice-aging report and a clearly defined overdue percentage: unpaid invoices past their contractual due dates divided by total trade receivables. Assign follow-up for material overdue balances. An average should not hide a large disputed invoice or one customer repeatedly missing payment commitments.
The receivables register below adds invoice-level detail to a collection review: due date, remaining balance, and expected cash date. It comes from the separate Northstar Supply cash-control demonstration, not the two-period distributor example used for the KPI calculations above.
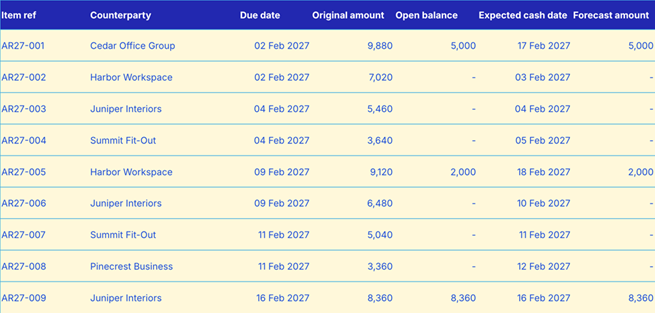
Figure 1. Invoice-level detail supports follow-up on late collections. This original Receivables sheet does not calculate DSO; it shows the records and collection assumptions to inspect behind an aggregate KPI.
Inventory, supplier payments, and the cash conversion cycle
The cash conversion cycle combines the three main timing measures:
Cash conversion cycle = Inventory days + Receivables days − Payables days.
ACCA explains that a longer cycle ties up resources for longer. It also warns that supplier power and customer terms limit how far a business can shorten the cycle. [3]
For a management calculation, use:
Inventory days = Average inventory ÷ Cost of sales × Days in the period.
Payables days = Average trade payables ÷ Credit purchases × Days in the period. [2]
Keep periods and tax treatment consistent. Where purchases are unavailable and cost of sales is used as a proxy for payables days, label the approximation—especially when inventory is changing significantly.
Review the components separately. Fewer inventory days achieved through frequent stockouts would need an operational explanation. More payables days caused by overdue bills should not be presented as a negotiated improvement in supplier terms.
For a service business with little inventory, focus on collections, unbilled work where relevant, payroll timing, and customer advances rather than forcing an inventory-based interpretation.
Monitor operating cash flow and the forecast low point
Operating cash flow shows cash generated or used by operating activities. It is distinct from borrowing, owner funding, and investment spending. The SEC’s financial-statement guide explains these categories and why earnings alone do not establish cash generation. [4]
Review operating cash flow beside profit and ask for an explanation of the main differences. Where a growing receivables balance is the explanation, the follow-up belongs in collections and commercial terms, not simply in an expense-reduction plan.
Then add a forward-looking measure: the lowest forecast cash balance and the date it occurs. BDC recommends a weekly rolling 13-week forecast for closer visibility into near-term cash. [6]
Show the chosen minimum cash reserve alongside that low point. Keep undrawn credit separate from bank cash; a planned drawing should appear explicitly in the forecast. For a tight week, inspect daily payments and collections rather than relying on a positive Friday closing balance.
My priority would be the period in which a decision becomes necessary, not the most attractive end-of-year number.
The cash dashboard in that workbook reports the forecast low point separately from the ending balance. It is a focused cash-control view, rather than the broader Financial Dashboard product discussed later.
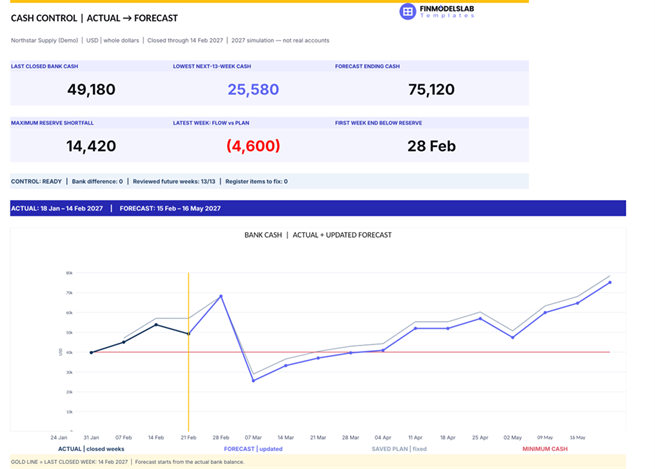
Figure 2. The workbook’s forecast low point is $25,580 even though the final balance is $75,120. The dashboard also identifies a reserve shortfall and its first week. These are figures from a separate teaching simulation.
Keep the budget—and update the forecast separately
For a positive revenue budget:
Revenue variance = Actual revenue − Budgeted revenue.
Revenue variance % = Revenue variance ÷ Budgeted revenue × 100%.
Suppose our distributor had budgeted $1.2 million for Period B. Actual revenue of $1.08 million would be $120,000 below budget, or 10% unfavorable, despite being 20% higher than Period A.
Both comparisons matter. One describes growth; the other tests the plan on which management based its commitments.
Preserve the original budget, retain the previous forecast, and update the current forecast with new evidence. Otherwise, moving the target can conceal the assumptions that were wrong.
Use labels as well as signs. A positive expense variance under an “actual minus budget” convention means spending exceeded budget; it is not automatically favorable. If the comparison base is zero or negative, an ordinary percentage variance can be misleading. Show the amount and explain the change.
For forecast accuracy, examine receipts and payments separately and distinguish timing errors from amount errors. Two large errors that cancel in the closing cash balance do not demonstrate a reliable forecast.
For a cash forecast, the following worksheet makes that distinction visible. The opening-cash difference is carried into the closing balance; it is not part of the current week’s cash-flow variance.
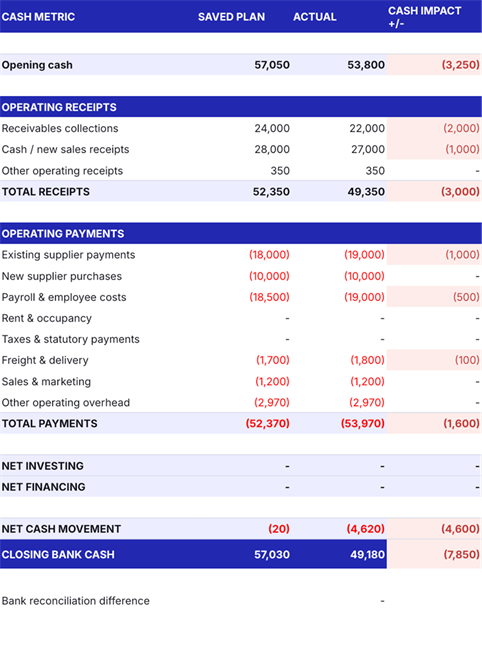
Figure 3. The $3,250 unfavorable opening-cash difference plus the $4,600 unfavorable weekly cash-flow variance gives the $7,850 closing-cash difference. This is a cash comparison, not a revenue or profit variance report.
What larger businesses should add
As a company expands across locations or business units, retain the consolidated view but add analysis where managers control resources. Two further measures deserve consideration.
Return on capital employed (ROCE) relates profit before interest and tax to capital employed. For a management trend, I would use average capital employed over the period, document the chosen definition, and keep it consistent. ACCA discusses ROCE as a measure of the return generated from the resources committed to a business. [5]
This provides a question that profit margin cannot answer alone: has the additional capital committed to growth produced a satisfactory operating return? Compare like periods and account for the timing of major investments.
Debt-service coverage compares a defined measure of earnings or cash available for debt service with scheduled principal and interest. BDC presents an EBITDA-based version. For borrowing decisions and covenant monitoring, use the definition and testing period in the relevant lending agreement rather than assume that every lender uses the same calculation. [1]
Neither measure needs to occupy the first page of every small-business dashboard. Add it when the capital or financing decision warrants attention.
Build a dashboard that supports a management meeting
For each KPI, record its definition, source, owner, review frequency, and the threshold that triggers investigation. Agree on those items before automating the report.
A practical review page can show the current period, budget, comparable prior period, and trend. Keep detailed customer, product, and invoice analysis behind that summary.
Financial Models Lab’s Financial Dashboard provides an Excel structure for monthly budget comparisons, profitability, liquidity, and working-capital measures, including the cash conversion cycle. Its published workflow uses entered monthly figures; it should not be mistaken for a live accounting-system integration or a complete set of every advanced metric discussed here.
For the report-building process, Excellent Business Plans also has a guide to creating a KPI dashboard that drives growth.
In the distributor example, I would set three immediate workstreams: investigate the margin decline, review overhead against the capacity plan, and identify the invoices behind the collection delay. Each needs an owner, a deadline, and a forecast of the financial effect of the proposed action.
Only then would I revisit the expansion decision. Asking for more sales without resolving those issues could reproduce the same result at a larger scale.
Frequently Asked Questions
How many financial KPIs should a growing business track?
For an initial management review, I would choose a compact set covering growth, profitability, working capital, and cash. Add detail only when it supports an identifiable decision. This is a design recommendation, not a universal target number.
What is a good gross margin or collection period?
There is no single benchmark I would apply to every business. Compare the company’s trend, relevant industry evidence, its commercial terms, and its operating model. A ratio needs context before it becomes a target. [1][3]
Should financial KPIs be reviewed weekly or monthly?
I would review near-term cash and material collections weekly, with a broader profitability and plan-versus-actual review after the monthly accounts are ready. Increase the frequency around a specific risk; do not create a weekly ratio simply because the software can display one.
Can a dashboard replace financial analysis?
A dashboard organizes results. It does not establish why a number changed or decide what management should do. The distributor’s 20% revenue growth is accurate; understanding its falling profit requires the cost, margin, and collection analysis beside it.
The purpose of the numbers
A growing business needs to know more than whether sales increased. It needs to know what the growth earned, how much money it absorbed, and which commitments it can safely make next.
For businesses that need help setting up that review, I provide financial modeling, management reporting, and fractional CFO support through Financial Models Lab. The engagement can connect the KPI definitions, financial forecast, and recurring management discussion; its scope is agreed separately from any template purchase.
About the author
Henry Sheykin is a co-founder of Financial Models Lab. His work includes financial modeling, budgeting, cash-flow planning, profitability analysis, and fractional CFO support. He helps business owners connect operating decisions with financial forecasts and management reporting.
Disclosure: The author has a commercial interest in Financial Models Lab and the products and services mentioned. All numerical examples are fictional and educational, not client results or industry benchmarks.
Sources
[1] BDC. 4 types of financial ratios to assess your business performance.
[2] BDC. How to use financial ratios to improve your business.
[3] ACCA. Working capital management.
[4] U.S. Securities and Exchange Commission. Beginners’ Guide to Financial Statements.
[5] ACCA. Ratio analysis.
[6] BDC. Plan your cash flow in the coming year.
[7] U.S. Small Business Administration. Break-even point.