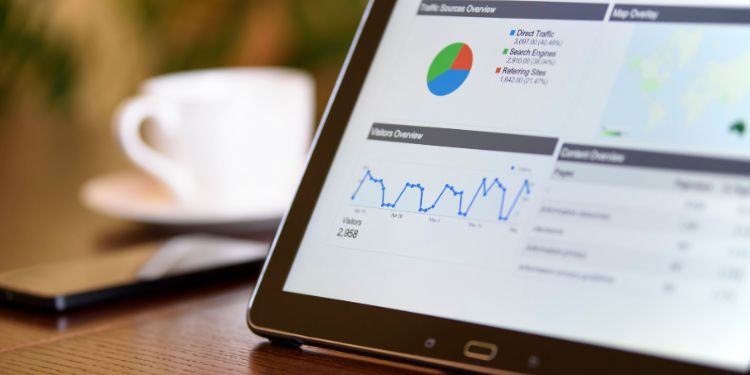

Most small businesses spend money on marketing without knowing what is actually working. A marketing performance dashboard helps bring that clarity into one place.
Learn how to build a marketing performance dashboard for your small business. Discover the key metrics, the right tools, and a step-by-step process to track what matters and stop wasting budget.
Introduction: You are probably flying blind with your marketing budget
If someone asked you right now which marketing activity is generating the most customers, could you answer with confidence? Not a gut feeling. The actual number.
Most small business owners cannot. They are posting, running ads, sending emails, and hoping something is working. When budget time comes, they make the same guess as last month.
A marketing performance dashboard changes that. It brings all your key numbers into one place so you can see what is generating leads, what is converting customers, and what is draining budget with nothing to show for it.
The numbers behind the measurement problem
The data on marketing measurement paints a clear picture of why this matters.
- According to Firework’s 2025 Marketing ROI Statistics, 83% of marketing leaders say demonstrating ROI is their top priority, up from 68% five years ago. Yet only 28% of marketers have a solid system for measuring it.
- According to Sender’s 2025 Marketing ROI benchmarks, 64% of companies base future marketing budgets on past ROI performance, meaning poor measurement directly compounds into poor budget allocation. If you do not measure well, you keep funding the wrong things.
- According to HubSpot research cited by Sender, marketers who measure ROI are 1.6 times more likely to receive higher budgets than those who do not because they can prove the value of what they are doing.
- According to Firework, 47% of marketers struggle to measure ROI across multiple channels, making attribution one of the biggest unsolved challenges in marketing today.
The gap between wanting to measure marketing performance and actually having a system to do it is where most small businesses lose money silently.
Why most small business barketing goes unmeasured
Three reasons hold most small businesses back. First, tool overload: data sits in Google Analytics, Meta Ads Manager, Mailchimp, and a spreadsheet with no easy way to pull it together. Second, vanity metrics: likes, followers, and impressions feel like progress but rarely connect to revenue. Third, not knowing which numbers matter: collecting too much data and acting on too little. A good dashboard solves all three by forcing you to track only what connects to business outcomes.
What Is a Marketing Performance Dashboard?
A marketing performance dashboard consolidates your most important marketing metrics across all channels into one place, updated weekly or monthly, to answer one question: is our marketing generating a return?
A good dashboard is not a wall of numbers. It is a carefully selected set of metrics simple enough to review in ten minutes and specific enough to help you prioritize what to focus on next. The key distinction: a report tells you what happened. A dashboard helps you consider what to do about it, but the decision still requires your judgment.
Going one level deeper: leading vs. lagging indicators
Most marketing dashboards track lagging indicators, metrics that measure what has already happened. Revenue, conversions, customer acquisition cost, and ROI are all lagging indicators. They are accurate but backward-looking. By the time they drop, the damage is often weeks old.
Leading indicators are earlier signals that predict future performance. In marketing, these include outreach activity, content published, email sequences initiated, social engagement rate, and pipeline volume. A pipeline with fewer qualified leads this week is a leading indicator that conversion numbers will drop in four to six weeks.
The most useful marketing dashboards track both. Lagging indicators tell you how the business is performing. Leading indicators tell you where it is likely heading. When you combine the two, your dashboard moves from a report on the past toward something closer to a navigation tool for the future.
The 7 metrics every small business marketing dashboard should track
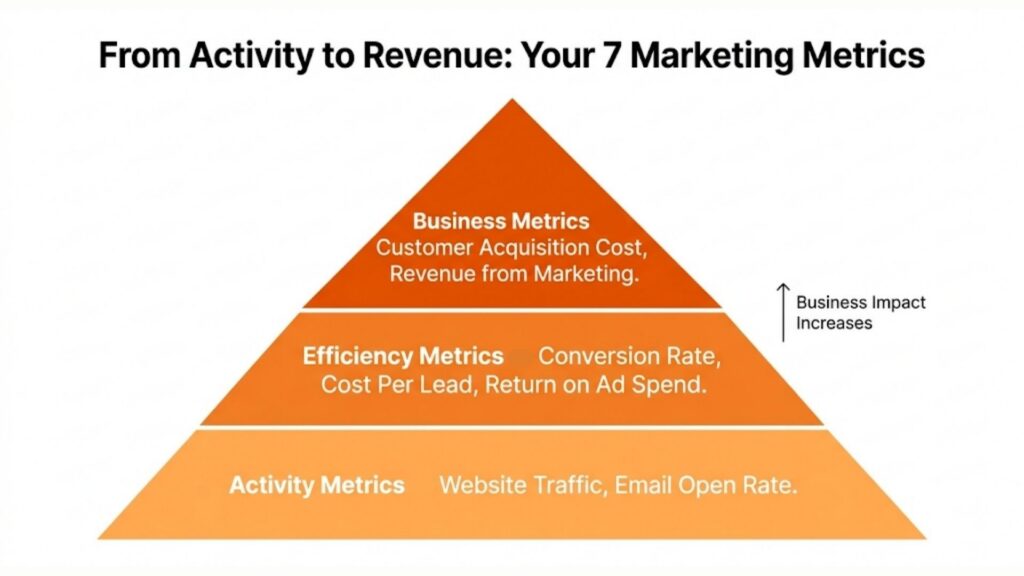
Metric 1: Website Traffic
How many people are visiting your website, and where are they coming from? Break this down by source: organic search, paid ads, social media, email, and direct. A channel generating no website traffic is not working, regardless of how many followers it has.
Metric 2: Conversion Rate
What percentage of website visitors are taking the action you want: filling a form, making a purchase, booking a call? A small improvement here compounds quickly. Doubling your conversion rate doubles your results without spending more on traffic.
Metric 3: Cost Per Lead (CPL)
Divide total marketing spend on a channel by the number of leads it produced. This separates channels worth investing in from channels worth dropping. High CPL and low conversion mean stop. Low CPL and high conversion means invest more.
Metric 4: Customer Acquisition Cost (CAC)
Total marketing and sales spend divided by new customers acquired in a period. CAC only tells half the story though. The other half is Customer Lifetime Value (CLV): how much a customer generates over their entire relationship with your business. A CAC of €200 is fine if a customer spends €1,000 over their lifetime, but a problem if they only buy once. Track repeat purchase rate and CLV alongside CAC. The ratio to watch: CLV should be at least three times your CAC. Below that, growth becomes expensive and fragile.
Metric 5: Return on Ad Spend (ROAS)
For paid advertising, how much revenue are you generating per dollar spent? A ROAS of 4:1 means four dollars returned for every one spent. The generally accepted benchmark for healthy digital marketing ROAS is 4:1 or above, though this varies by industry.
Metric 6: Email Marketing Performance
Track open rate, click-through rate, and conversion rate per campaign. Email consistently delivers among the highest ROI of any channel. Open rates below 20% signal weak subject lines. Click rates below 2% signal weak content or offers.
Metric 7: Revenue Attributed to Marketing
What percentage of total revenue can be traced back to marketing activity? This is one of the trickiest metrics to measure accurately. Multi-touch attribution, where a customer interacts with multiple channels before buying, means no single channel ever gets the full picture. A reasonable estimate is more useful than perfect paralysis, but treat this number as directional rather than precise.
Alongside revenue attribution, track customer satisfaction signals: your Net Promoter Score (NPS), review sentiment across Google and other platforms, and repeat purchase rate. These are not traditional marketing metrics, but they are some of the most honest indicators of whether your marketing is attracting the right customers and whether the experience is living up to the promise. A business with high revenue and declining NPS is building on unstable ground.

How to build your marketing performance dashboard in 5 steps
Step 1: Define what you are trying to measure
Decide what success looks like before choosing any tools. More leads? Lower CAC? Repeat purchases? Build your dashboard backwards from your business goal, not forwards from whatever data happens to be available.
Step 2: Choose your metrics
Select the metrics most relevant to your business model. Service businesses prioritize CPL and CAC. E-commerce businesses focus on ROAS and Conversion Rate. Content-led businesses weight Email Performance and Traffic. Start with five metrics maximum and add more later.
Step 3: Connect your data sources
Identify where each metric lives: Google Analytics for website data, Meta Ads Manager or Google Ads for paid advertising, your email platform for email metrics, your CRM for revenue attribution. Minimize manual entry and automate wherever possible.
Step 4: Choose your dashboard tool
| Tool | Best For | Cost |
| Google Looker Studio | Connecting Google data sources, free and flexible | Free |
| HubSpot Marketing Hub | All-in-one CRM and marketing tracking | Paid |
| Databox | Pulling multiple platforms into one dashboard | Free and paid plans |
| Monday.com | Work management platform with marketing dashboard capabilities, best for teams tracking campaigns and project workflows | Paid |
| Excel or Google Sheets | Simple, manual dashboards for very small budgets | Free |
For most small businesses starting out, Google Looker Studio connected to Google Analytics and a spreadsheet for non-Google data is the most practical and cost-effective starting point.
Step 5: Set a review cadence and act on it
A dashboard nobody reviews is useless. Set a fixed weekly or monthly review with one question: what does this tell me about where to focus next? Measurement is only valuable when it drives decisions.
Vanity Metrics vs. Performance Metrics: Know the difference
Tracking metrics that feel good but do not drive decisions is one of the most common dashboard mistakes.
| Vanity Metric | Why it is Misleading | Performance Metric to Track Instead |
| Social media followers | Followers do not equal customers | Leads generated from social |
| Post impressions | Reach without action means nothing | Click-through rate and website visits |
| Email subscribers | List size means little without engagement | Open rate, click rate, conversions |
| Page views | Traffic without conversion is just noise | Conversion rate by page |
| Ad clicks | Clicks without purchases waste budget | Cost per lead and ROAS |
The rule is simple: if a metric cannot connect to revenue in a clear chain of logic, it probably does not belong in your performance dashboard.
A practical example: What a small business dashboard looks like
To make this concrete, here is what a simplified monthly dashboard might look like for a small B2B consulting firm running three marketing channels. The numbers below are illustrative, but the pattern they reveal plays out regularly in real businesses:
| Channel | Monthly Spend | Leads Generated | Cost Per Lead | Customers Acquired | CAC |
| Organic Content | €500 (time) | 12 | €42 | 3 | €167 |
| LinkedIn Ads | €1,500 | 8 | €188 | 2 | €750 |
| Email Marketing | €100 | 6 | €17 | 2 | €50 |
The story is clear even with illustrative numbers. Email has the lowest CPL and CAC. LinkedIn is generating leads but at a much higher cost. Organic content is performing well relative to investment. The decision practically makes itself.
This is what a dashboard does: it replaces a budget conversation based on opinion with one based on evidence.
“Without data, you are just another person with an opinion.”
— W. Edwards Deming, Statistician and Business Consultant
Final thoughts: Measure less, decide better
The goal is not to track everything. It is to track the right things consistently enough to make better decisions than competitors who are guessing.
Start small. Pick five metrics. Build a simple dashboard in Google Looker Studio or a spreadsheet. Review it monthly. After 90 days, you will have more clarity than most businesses develop in years. The businesses that grow predictably are not spending the most on marketing. They simply know what is working.
Your next step …
A marketing performance dashboard works best when it sits inside a broader marketing strategy. The Marketing KPI Template from excellentbusinessplans.com gives you a structured framework to define, track, and review your key marketing metrics in one place so every budget decision is grounded in data rather than opinion. And if you are ready to build the strategy that your dashboard will measure, the Marketing Plan Template gives you the complete structure to plan, execute, and track your marketing from start to finish.
Frequently Asked Questions (FAQ)
1. What is a marketing performance dashboard? A marketing performance dashboard is a single consolidated view of your most important marketing metrics across all channels. It is updated regularly and designed to answer one question: is our marketing generating a return? Unlike a report that shows historical data, a dashboard is designed to drive decisions about where to invest next.
2. What metrics should a small business track in a marketing dashboard? The seven most important metrics for most small businesses are website traffic by source, conversion rate, cost per lead, customer acquisition cost, return on ad spend, email marketing performance, and revenue attributed to marketing. Start with the three or four most relevant to your business model before adding more.
3. What is the difference between vanity metrics and performance metrics? Vanity metrics are numbers that look good but do not connect to revenue. Followers, impressions, and page views are examples. Performance metrics are numbers that connect directly to business outcomes: leads generated, conversion rate, cost per acquisition, and revenue. A good dashboard tracks performance metrics and ignores vanity metrics.
4. What tools can I use to build a marketing dashboard? Google Looker Studio is the most practical free option for small businesses, especially if you are already using Google Analytics and Google Ads. For teams wanting an all-in-one solution, HubSpot Marketing Hub or Databox are strong options. For businesses with very limited budgets, a well-structured Google Sheet updated monthly is a perfectly valid starting point.
5. How often should I review my marketing dashboard? Monthly is the minimum. Weekly is better for businesses running active paid advertising campaigns where budget decisions need to be made more frequently. The key is consistency: pick a cadence and stick to it. A dashboard reviewed irregularly provides far less value than one reviewed on a fixed schedule.
6. What is a good marketing ROI benchmark? According to industry data, a 5:1 ROI is the generally accepted benchmark for good performance in digital marketing, meaning five dollars returned for every one dollar spent. For paid advertising specifically, a ROAS of 4:1 or above is considered healthy. However, these benchmarks vary significantly by industry, margin, and business model. The most useful benchmark is your own historical performance over time.
7. What is a healthy Customer Acquisition Cost ratio?
The standard benchmark is a CLV to CAC ratio of 3:1, your Customer Lifetime Value should be at least three times your acquisition cost. If it costs €200 to acquire a customer, they should generate at least €600 over their lifetime. Below 3:1 means your marketing is too expensive relative to the value customers bring. Significantly above 3:1, say 6:1 or higher, may indicate you are underinvesting in marketing and leaving growth on the table. The 3:1 ratio is the sweet spot for most growing businesses.
References
- Firework. (2025). Marketing ROI Statistics: 30+ Stats to Boost Your Strategy in 2025. https://firework.com/blog/marketing-roi-statistics
- Sender. (2025). Marketing ROI Statistics 2025\u20132026: Benchmarks by Industry and Channel. https://www.sender.net/marketing-glossary/return-on-investment-roi/statistics/
- 1ClickReport. (2025). Marketing ROI Dashboard Guide: Track and Maximize Return on Investment. https://www.1clickreport.com/blog/marketing-roi-dashboard-guide
- Dataslayer. (2025). Marketing Dashboard Best Practices: The Ultimate Guide for 2025. https://www.dataslayer.ai/blog/marketing-dashboard-best-practices-2025
- Monday.com. (2026). Marketing Dashboard: How to Build and Scale Reporting in 2026. https://monday.com/blog/marketing/marketing-dashboard/
- Improvado. (2026). ROI Dashboard Guide 2026: Build and Optimize Marketing Reports. https://improvado.io/blog/roi-dashboard
- Deming, W. E. (1986). Out of the Crisis. MIT Press. https://www.amazon.com/Out-Crisis-W-Edwards-Deming/dp/0262541157